HubSpot reporting allows you to follow the end-to-end experience of your customers. A full-stack HubSpot portal keeps everything in one place and thus reporting can be compiled from all data without consulting external sources or dreaded spreadsheets.
HubSpot does daily reporting super well. In fact, it does it so well that most of our clients refer to HubSpot on a daily basis, and only dig into other reporting platforms like Google Analytics on a monthly basis.
Why HubSpot Reporting works so well
But first, let’s outline why instantly available and accurate reporting is so important.
Acquiring customers and growing a business today is about digital. Digital marketing and digital sales. Even servicing your customers in the digital realm is now a given with online chatbots and ticketing.
It’s a constant balancing act between adapting to the needs of your customers and innovating to grow and scale your business. How do you know if you are doing the right thing? How do you know if your messaging is resonating with your customers?
The answer is in the data. HubSpot reporting is directly plugged into your customer data - your CRM. It’s super accurate and always up to date.
But I have Google Analytics and Adwords reporting already
Yes, you do. And it’s free - but there is a key difference.
With Google Analytics and Adwords reporting you know your conversion rates and how many people converted. You also know which ads converted best.
With HubSpot Reporting, you can link the conversion to a real person including their full name, email, preferences, previous website visits and even interactions with the sales team. The entire user journey is tracked!
What is HubSpot reporting?
HubSpot reporting consists of three different categories which can all be found under the Reports menu in HubSpot.
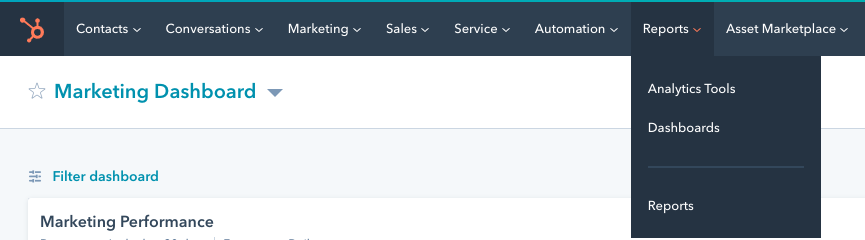
- HubSpot Analytics Tools
- HubSpot Dashboards
- HubSpot Reports
Each type of report references data within HubSpot CRM, Marketing Hub, Sales Hub, Service Hub and CMS Hub for easy built-in reports.
As mentioned above, the direct connection to HubSpot CRM makes the data super accurate and always up to date.
What can HubSpot report on?
As mentioned above HubSpot reports, analytics and dashboards collect data from within your HubSpot portal - contacts, properties, emails, activities, deals and tickets can all be compared and analysed.
Properties - Standard and custom fields of different types of information you collect about your records in HubSpot.
Deals - Track revenue through a sales pipeline
Emails - Email activities such as sends, opens, clicks and bounce data is recorded and associated with the appropriate contact.
Activities - These are interactions that are recorded on a record's timeline such as website visits, emails, calls, tasks and meetings.
Tickets - Represent a request for help from your customers or users - helping you track issues
Website analytics - For tracking traffic by source, topic cluster, device type, country, and more
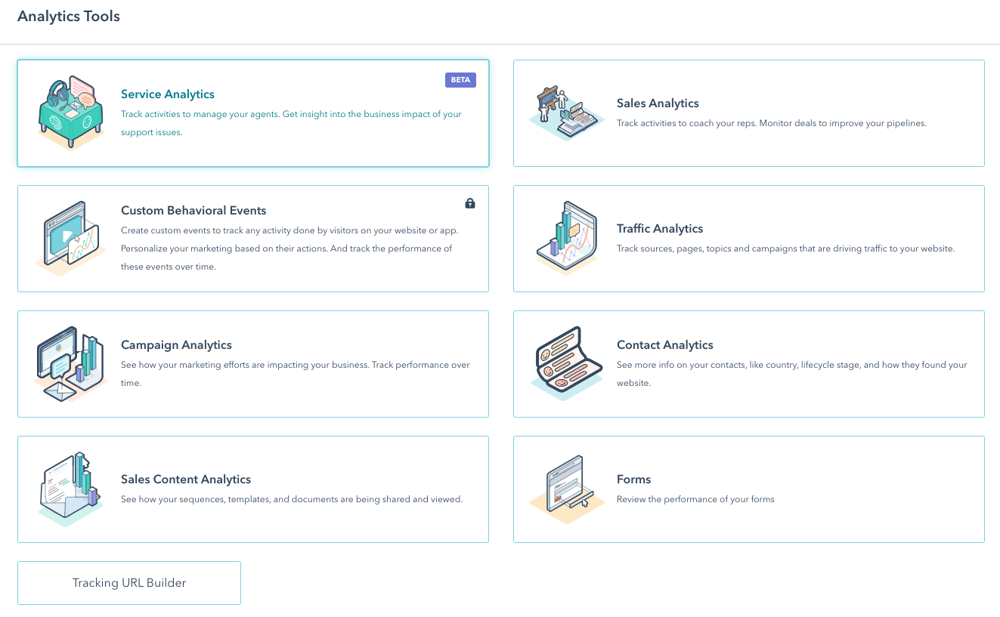
1. HubSpot Analytics Tools
HubSpot reports provide readable and are usually quite stylized summaries that visually make sense of data. Reports are usually viewed as part of a dashboard.
Marketing reports
Seeing a campaign through requires being able to report on all actions from beginning to end and with most campaigns making use of different platforms it can get quite messy.
HubSpot reporting reduces the noise by collating the data from all platforms used and attributing those sources to any website traffic/lead captured. Campaigns bring together all assets, landing pages, forms, ads, emails and workflows linked to that campaign for an entire overview of campaign performance.
As a contact moves through a workflow or is nurtured through emails, their actions through that process are recorded and easily reported on, identifying what you’re doing right, where you can improve, and learn the same about other companies in the field.
Website reporting
A website built in HubSpot CMS or an alternative connected to HubSpot through integration gathers sessions, source, contacts, bounce rate and session length data which can be used to report on the effectiveness of landing pages, blogs and the campaign that may have brought them there.
Conversion tracking is a breeze with form tracking where views and submissions are all recorded and attributed and can later be attributed to any deals later won.
Service reporting
Create reports in the service analytics tool to track your customer service team's success. For example, measure post-support survey scores, average ticket response time, and overall support volume.
You also get reports on what questions are most often asked, and which knowledge base articles are most often viewed.
Sales reporting
Create reports on tracked contact activities and identify top contact mediums. With all activities tracked, a holistic view of your sales process can be formed. Any issues or challenges your sales team is facing can be identified/optimised for higher conversions.
Sales team productivity can also be tracked to help sales reps prioritise quality leads and optimise response times.
Beyond standard deal reporting, HubSpot offers excellent forecasting, change history and quota attainment. Helping your sales reps manage their upcoming business and where to focus to move deals through their funnel.
HubSpot’s added features of automated sales sequences, templates, and tracked documents give sales an edge, so tracking the impact it has is essential.
2. HubSpot Reports (Custom reporting)
HubSpot has built-in custom reporting. With custom reports, you have more flexibility in analyzing objects and activities in your HubSpot account. With a variety of different types of custom reports that you can create, with individual filters based on your reporting needs.
These HubSpot reports can pull data from every connected aspect of HubSpot to create the reports you and management need, automatically and in the visual style you want it represented in.
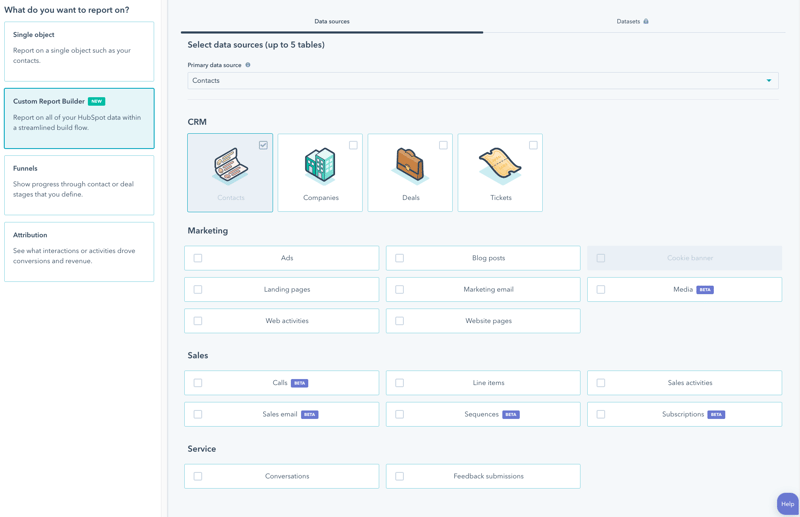
Depending on your subscription, you can create the following types of HubSpot custom reports:
Single object reports: Analyze contacts, companies, deals, tickets, custom objects, activities, line items, or feedback submissions.
Funnel reports: Measure the conversion rates between certain stages in a customer's lifecycle or deal pipeline. If you have an Enterprise subscription, you can also create a custom events funnel.
Custom report builder: An advanced report builder that enables you to analyze objects in relation to marketing, sales, and service activities.
Contact attribution reports: Measure which sources, assets, and interactions impacted lead generation (Marketing Hub and CMS Hub Enterprise only).
Deal creation attribution reports: Measure which sources, assets, and interactions impacted deal generation (Marketing Hub Enterprise only).
Revenue attribution reports: Measure which sources, assets, and interactions had the greatest impact on revenue (Marketing Hub Enterprise only).
HubSpot custom reports allow you to get an in-depth and birds-eye view of your business insights that a default report doesn’t offer.
3. HubSpot Dashboards
Dashboards bring all your favourite reports to one central location for your team and management to get a full view quickly and easily. No more monthly rush to get reports in. Dashboards are real-time and automatic.
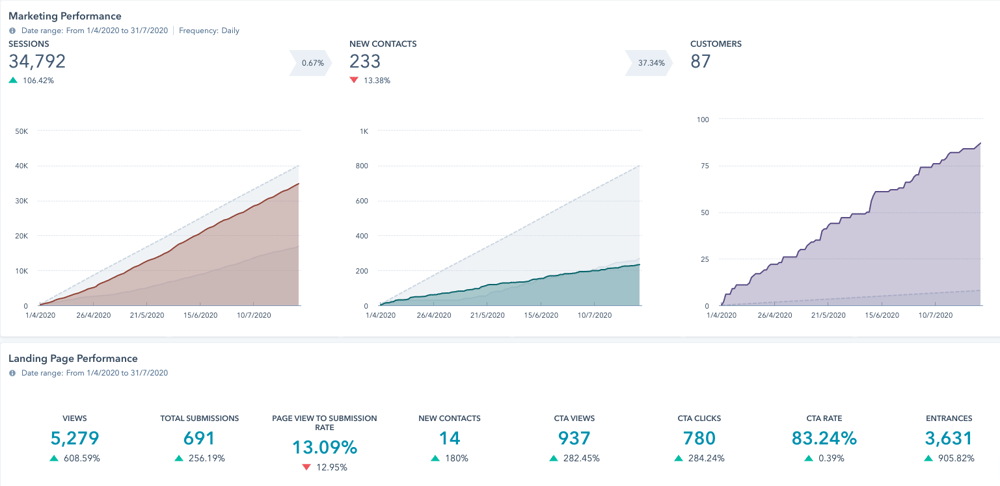
Default marketing dashboards present up to ten reports that focus on the most common marketing metrics, such as page views, conversion rates, and email performance.
The default sales dashboard consists of five reports. These are deal forecast, deals closed vs goal, team activity, sales performance, and productivity.
Default service dashboards can be used to view your ticket, knowledge base, and customer feedback performance.
Benefits of reporting in HubSpot
All-in-one
There are a number of tools that pull data from all your marketing, sales and service tools but with HubSpot, if you are using their full suite of tools, every aspect of your business efforts is natively integrated and tracked.
This means reports are naturally generated automatically and in real-time and most importantly you can keep an eye on your entire customer journey.
Intuitive and beautiful
HubSpot reports and dashboards are very easy to use and set up. No coding or integrating systems are required, just pick the objects you want to report on and compare in no time at all.
How to create reports in HubSpot
Follow these simple steps:
Create a blank report: Select your data sources and the format you want to display your data.
Add fields to the report: select the specific property, event, and activity data to report on.
Customize your filters: set limits and boundaries for the fields you've added.
Save or export the report: make your report available for yourself and others to view, or export it to take your data offline.
For a detailed run down, here is a very handy guide that will help you build any report you need with the custom reports builder.
Final thoughts
The old ways of spending hours building reports in spreadsheets and presentations are over. With HubSpot reporting tools all your data is coordinated into one platform and with all your data Instead of spending time connecting reports from different tools and inserting information into Excel or PowerPoint, just use the reporting add-on and share your reports with your team, marketing director and board with ease.