

You've done the work. You've set up llms.txt. You've created per-page .md files. You've audited your robots.txt. Your content is clean, structured, and AI-readable.
But how do you know if any of it is working?
How do you know which pages ChatGPT, Claude, or Perplexity have actually consumed? How do you know whether AI systems are reading your content at all?
This is the biggest unsolved problem in AEO. And it's more solvable than you think.
Why your current analytics can't answer this
Google Analytics filters out bot traffic. HubSpot analytics shows human visitors. Webflow, Shopify, and WordPress analytics platforms are all designed to track people in browsers, not AI crawlers making server-side requests.
These tools weren't built to show you that ClaudeBot visited your solutions page at 3am, or that GPTBot has been hitting your blog every Tuesday for the past month, or that PerplexityBot accessed your pricing page but got a 403 because your robots.txt is blocking it.
You have a massive blind spot. AI systems are making retrieval decisions about your content - deciding whether to include you in answers or ignore you - and you can't see any of it in your dashboards.
This is like running a shop where half your potential customers are invisible. They walk in, browse your shelves, and either recommend you to everyone they know or walk out silently. And you have no idea they were ever there.
The DIY approach: server log analysis
If you have access to raw server logs or CDN logs, you can search for AI crawler user agents manually:
grep -i "claudebot\|gptbot\|perplexitybot\|chatgpt-user" access.logThis gives you raw entries showing which AI bots hit which pages and when. It works, but it has significant limitations:
- Most CMS-hosted sites don't give you access logs. If your site is on HubSpot, Webflow, Shopify, or many managed WordPress hosts, you don't have raw server logs. The CMS handles serving and logging internally.
- CDN logs are separate. If you're on Cloudflare, Fastly, or Akamai, you need to access CDN-level logs, which are often in a different system with their own retention policies.
- No visualisation. Raw log lines don't show you trends, patterns, or which pages are getting more attention over time.
- No alerting. You won't know that GPTBot suddenly stopped visiting, or that a new crawler started hitting your site, unless you're actively checking.
- Manual process. Someone has to run the grep, parse the results, and make sense of them. This doesn't scale.
For sites that have log access, this is a useful starting point. But it's a far cry from the kind of analytics that let you make decisions.
What you actually need to track
Effective AI crawl analytics answers six questions:
1. Which LLM bots are visiting?
Not all AI crawlers are equal. Knowing that ClaudeBot visits regularly but GPTBot doesn't tells you that your content is reaching Claude users but not ChatGPT users. That's actionable - it might mean your robots.txt is blocking OpenAI's crawler, or that OpenAI's crawler hasn't discovered your content yet.
The major LLM bots to track: Anthropic (ClaudeBot), OpenAI (GPTBot, ChatGPT-User), Google (Googlebot, Google-Extended), Perplexity (PerplexityBot), Microsoft (BingBot), Apple (Applebot), Meta (Meta-ExternalAgent), Amazon (Amazonbot), ByteDance (Bytespider), Cohere, Diffbot, and Common Crawl (CCBot).
2. Which pages are they hitting?
This tells you what AI systems consider valuable about your site. If crawlers are hitting your blog posts but ignoring your service pages, that's a signal. If they're hitting your llms.txt but not following the links to individual .md files, that's a different signal.
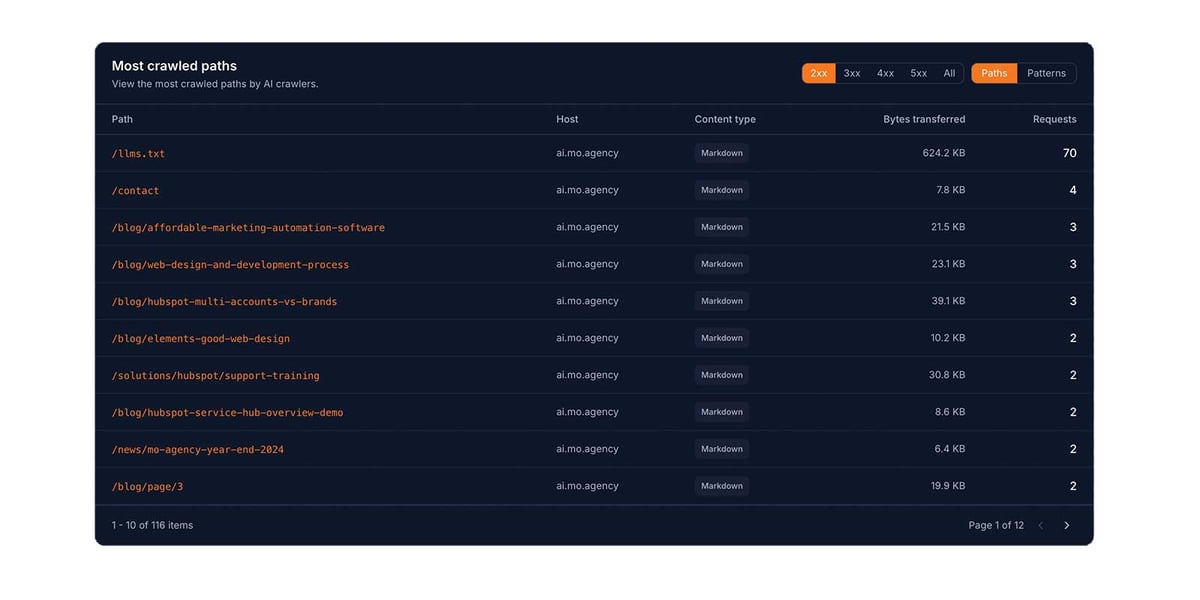
The most-crawled paths table tells you which content AI systems are consuming - and by implication, which content they're likely to cite when users ask relevant questions.
3. How frequently are they visiting?
A time-series chart of AI crawl requests over 30, 60, or 90 days reveals patterns you can't see from raw numbers. Is activity increasing? Decreasing? Steady? Spiking on certain days?
Increasing crawl activity generally means AI systems are finding your content valuable and coming back for more. Decreasing activity might mean something broke - a robots.txt change, a discovery tag that was removed during a site update, a server error on your .md endpoints.
4. What response codes are they getting?
This is where problems surface:
- 200 - The crawler got your content. Good.
- 301/302 - The crawler was redirected. Might be fine (e.g., www to non-www redirect) or might indicate broken URLs.
- 403 - Forbidden. Your robots.txt or server configuration is blocking this crawler. This is the most common problem - and you'll only know about it if you're tracking response codes.
- 404 - Not found. The crawler requested a page that doesn't exist. Might indicate stale links in your llms.txt or broken discovery tags.
- 500/502 - Server error. Your .md endpoint is failing for this page.
5. How much data are they consuming?
Total data served tells you the volume of content AI systems are actually processing. If bots are making requests but consuming very little data, they might be hitting error pages or cached empty responses.
6. What's the cache hit rate?
If your .md files are cached, a high cache hit rate means bots are getting fast responses. A low rate means every request triggers a fresh conversion - which is fine for freshness but worth knowing for performance.
The connection: indexing → visibility → citation
Here's the insight that makes all of this commercially valuable.
When an AI crawler hits one of your .md pages and gets a 200 response, the content of that page enters the AI system's knowledge. Not hypothetically - actually. The crawler consumed your clean markdown content, with its YAML frontmatter, clear headings, and structured information.
If that content is well-structured, authoritative, and relevant, the LLM will use it. When a user asks a question that your content addresses, the AI system will draw on what it consumed from your .md file and include it in its answer.
You can test this yourself. Check your AI crawl analytics and find a page that ClaudeBot has accessed. Then go to Claude and ask a question that your page answers. The AI will likely know about your content and reference it.
This is the direct link between AI crawl analytics and brand visibility:
- Crawl analytics show you which pages have been consumed by specific AI systems
- If a page has been consumed, the AI system has your content in its knowledge
- When a user asks a relevant question, the AI system will draw on that knowledge
- If your content is the best answer, the AI will cite you
No other measurement approach gives you this visibility. Traditional brand monitoring tools like Profound or Ahrefs Brand Radar can tell you after the fact whether you're appearing in AI responses. AI crawl analytics tells you before - which pages the bots are reading, which means you can predict visibility and take action on gaps.
What the analytics look like in practice
A purpose-built AI crawl analytics dashboard shows:
Summary panel - Total requests from AI crawlers in the selected period, how many received 200 responses, total data served. At a glance: "900 requests from AI crawlers, all 200s, 9.47 MB of markdown served."
Top insights - The most crawled path and the most active crawler. "The /pricing page is the most crawled path with 99 requests. 206 requests were from OpenAI."
Metrics - Total requests, unique pages accessed, cache hit rate, data served. These four numbers tell you the health of your AI readability infrastructure.
Requests over time - A 30-day time-series chart showing daily crawl volume. You can spot trends, anomalies, and the impact of changes you've made.
Crawler breakdown - Which companies' bots are visiting, broken down by specific bot name (ClaudeBot, GPTBot, ChatGPT-User, PerplexityBot, etc.) with request counts and data volume per bot.
Most crawled paths - A table showing which pages are being accessed most, with response codes, content types, data volume, and request counts. Filterable by status code (2xx, 3xx, 4xx, 5xx) to quickly find problems.
Crawler filter - A dropdown to isolate traffic from a specific AI company: Anthropic, OpenAI, Google, Perplexity, Microsoft, Apple, Meta, Amazon, ByteDance, Cohere, Diffbot, or Common Crawl.
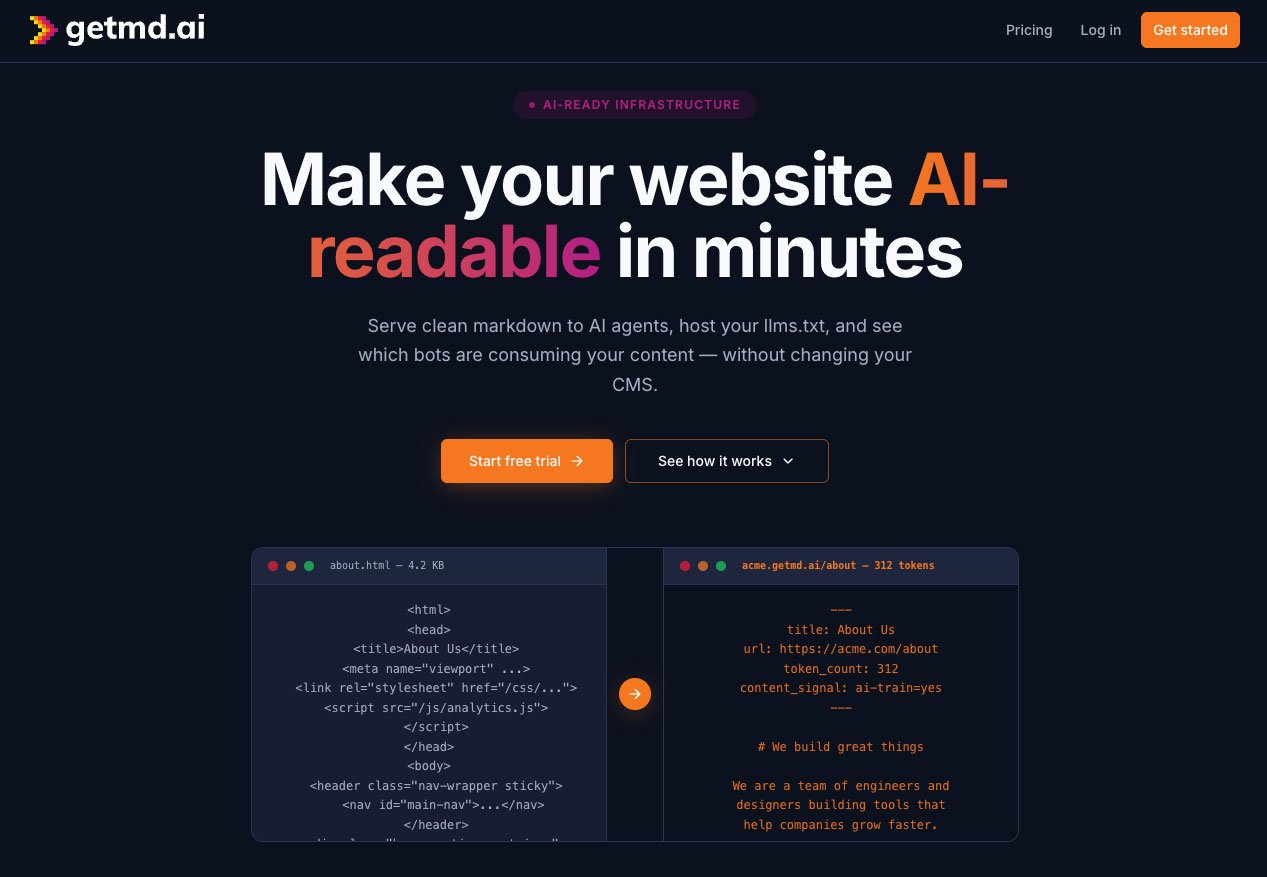
Getmd.ai provides all of this as part of its analytics dashboard. As far as we can tell, it's the only platform offering dedicated AI crawl analytics - showing which bots are visiting, which pages they're hitting, response codes, data volume, and trends over time. The data is real, from your actual endpoints, not estimated or sampled.
What to do with the data
The analytics become actionable when you know how to interpret them:
Pages getting crawled → verify by asking the LLM. If ClaudeBot has been hitting your solutions/hubspot page regularly, go to Claude and ask: "What HubSpot implementation partners operate in South Africa?" If your content is good, you should appear. If you don't, the content structure might need work even though the crawler is consuming it.
Pages NOT getting crawled → diagnose why. Check that the discovery tags are installed on those pages. Verify the .md endpoint returns a 200. Check that robots.txt isn't blocking the path. Check whether those pages are linked from your llms.txt.
Declining crawl activity → investigate changes. Did someone update your CMS templates and accidentally remove the discovery tags? Did a robots.txt change go live? Did your .md endpoints start returning errors? Declining crawl activity is a signal that something broke.
New bot appearing → a new AI system found you. If PerplexityBot suddenly starts showing up in your logs when it wasn't before, Perplexity has discovered your content. Good news.
High 4xx rate → access problems. If a significant percentage of requests are getting 403s or 404s, you have a configuration problem that's blocking AI access to your content.
The brand visibility feedback loop
Putting it all together, the workflow is:
- Build the infrastructure - markdown, llms.txt, per-page .md files, discovery tags, unblocked crawlers, Content Signals
- Monitor AI bot activity - track which bots visit, which pages they hit, frequency, response codes, trends
- Verify visibility - test in actual AI assistants to confirm your content is being cited
- Identify gaps - pages that aren't being crawled, bots that aren't visiting, declining activity
- Iterate - fix access problems, improve content structure, expand coverage, track changes
This is AEO as a measurable practice. Not theory. Not hope. Observable data that connects what AI systems are consuming to whether your brand appears in their answers.
The websites that close this feedback loop - that can see what AI systems are reading, verify whether it translates to visibility, and act on the gaps - are the ones that will dominate AI search. The ones that can't are optimising blind.
This article is part of our series on making your website AI-readable. Also in this series: What is markdown? · What is llms.txt? · Per-page .md files · The robots.txt audit · Content structure for AI · Content Signals